Charting Sunrise and Sunset in Highcharts
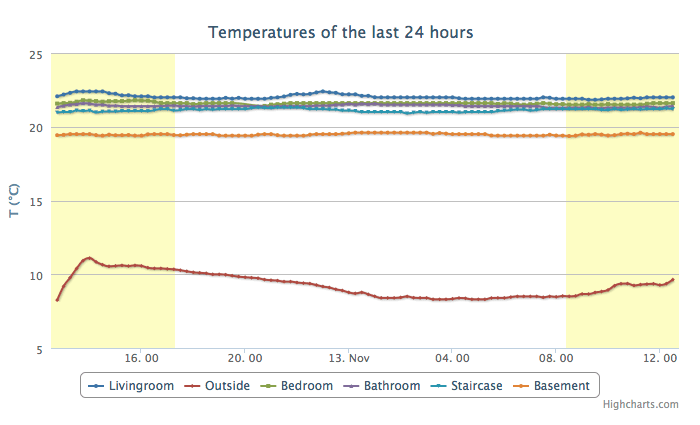
In order to visually enhance my temperature logging I added some Javascript that computes sunrise and sunset for the 24h, 28h, weekly and monthly chart. Then I use this information to plot vertical bands on the chart indicating the effects of the sun on temperatures (and humidities):
This file contains bidirectional Unicode text that may be interpreted or compiled differently than what appears below. To review, open the file in an editor that reveals hidden Unicode characters.
Learn more about bidirectional Unicode characters
function computeSunrise(day, sunrise) { | |
/*Sunrise/Sunset Algorithm taken from | |
http://williams.best.vwh.net/sunrise_sunset_algorithm.htm | |
inputs: | |
day = day of the year | |
sunrise = true for sunrise, false for sunset | |
output: | |
time of sunrise/sunset in hours */ | |
//lat, lon for Berlin, Germany | |
var longitude = 13.408056; | |
var latitude = 52.518611; | |
var zenith = 90.83333333333333; | |
var D2R = Math.PI / 180; | |
var R2D = 180 / Math.PI; | |
// convert the longitude to hour value and calculate an approximate time | |
var lnHour = longitude / 15; | |
var t; | |
if (sunrise) { | |
t = day + ((6 - lnHour) / 24); | |
} else { | |
t = day + ((18 - lnHour) / 24); | |
}; | |
//calculate the Sun's mean anomaly | |
M = (0.9856 * t) - 3.289; | |
//calculate the Sun's true longitude | |
L = M + (1.916 * Math.sin(M * D2R)) + (0.020 * Math.sin(2 * M * D2R)) + 282.634; | |
if (L > 360) { | |
L = L - 360; | |
} else if (L < 0) { | |
L = L + 360; | |
}; | |
//calculate the Sun's right ascension | |
RA = R2D * Math.atan(0.91764 * Math.tan(L * D2R)); | |
if (RA > 360) { | |
RA = RA - 360; | |
} else if (RA < 0) { | |
RA = RA + 360; | |
}; | |
//right ascension value needs to be in the same qua | |
Lquadrant = (Math.floor(L / (90))) * 90; | |
RAquadrant = (Math.floor(RA / 90)) * 90; | |
RA = RA + (Lquadrant - RAquadrant); | |
//right ascension value needs to be converted into hours | |
RA = RA / 15; | |
//calculate the Sun's declination | |
sinDec = 0.39782 * Math.sin(L * D2R); | |
cosDec = Math.cos(Math.asin(sinDec)); | |
//calculate the Sun's local hour angle | |
cosH = (Math.cos(zenith * D2R) - (sinDec * Math.sin(latitude * D2R))) / (cosDec * Math.cos(latitude * D2R)); | |
var H; | |
if (sunrise) { | |
H = 360 - R2D * Math.acos(cosH) | |
} else { | |
H = R2D * Math.acos(cosH) | |
}; | |
H = H / 15; | |
//calculate local mean time of rising/setting | |
T = H + RA - (0.06571 * t) - 6.622; | |
//adjust back to UTC | |
UT = T - lnHour; | |
if (UT > 24) { | |
UT = UT - 24; | |
} else if (UT < 0) { | |
UT = UT + 24; | |
} | |
//convert UT value to local time zone of latitude/longitude | |
localT = UT + 1; | |
//convert to Milliseconds | |
return localT * 3600 * 1000; | |
} |
To add the bands to your Highchart just get the sunrise and sunset value for a particular day and push it on the xAxis.plotbands.
The resulting chart: