Gathering and Charting Temperatures using RRDTool and Highcharts
**tl;dr Checkout the charts on my RaspberryPi **
For quite a long time I was looking for a way to monitor and record th temperature and humidity at my apartment. What was missing was a convenient, preferably wireless solution. After receiving my RaspberryPi I started to look into that more intensively.
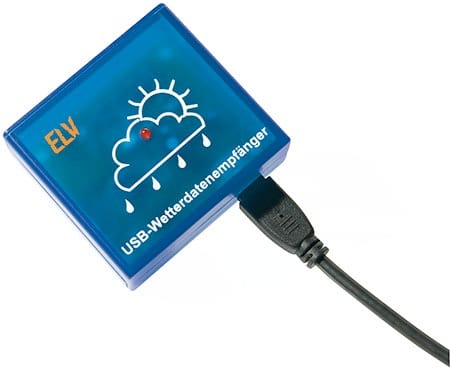
USB-WDE1 Receiver
The USB Weather Data Receiver USB-WDE1 wirelessly receives data from various weather sensors of ELV at 868 MHz. The receiver is connected to a USB port on the computer, so no additional power supply is required. The data is transmitted via a simple serial ASCII protocol, which is well documented by ELV. The RasberryPi running Raspbian is used for the data acquisition allowing very little power consumption while being completely flexible.
The USB interface of the USB WDE1 is realized by the USB-serial converter CP 2102 of Silicon Labs. The responsible kernel module CP2101 for accessing the device is included in any modern Linux distribution. When connecting the USB-WDE1 should appear in the system once the appropriate messages:
$ dmesg
usb 1-3.1: Product: ELV USB WDE1 weather data receiver
usb 1-3.1: Manufacturer: Silicon Labs
The udev subsystem then also creates a corresponding device file, usually is the / dev/ttyUSB0. This device behaves as seen by a Linux application program such as a serial port and therefore can be accessed with any terminal program such as minicom. If you connect other USB-to-serial converter to the RaspberryPi, the device can also be called /dev/ttyUSB1 or similar. It is important to set the baud rate to 9600 bits/s.
A simple and universal way to output the data supplied by the receiver on the terminal provides to tool socat, which should also be part of any Linux distribution. You may have to re-install it via the package manager. Using
$ socat / dev/ttyUSB0, B9600 STDOUT

$1;1;;21,6;9,5;21,6;21,3;21,1;19,2;;;58;78;58;59;42;53;;;;;;;;0
$1;1;;21,6;9,5;21,6;21,3;21,1;19,3;;;58;78;58;59;42;53;;;;;;;;0
$1;1;;21,6;9,5;21,6;21,3;21,1;19,3;;;58;78;58;59;42;53;;;;;;;;0
Each line represents a complete data set consisting of 25 semicolon-separated fields. The first three fields are immutable, followed by the measured temperature (°C) of eight sensors and their humidity values(%). The next fields show temperature (° C), humidity (%), wind speed (km / h), precipitation (rocker beats) and rain sensor (0/1) of the combination sensors. Since I do not have a combination sensor I won't focus on those values. The last field with the fixed value of 0 indicates the end of the record.
Gathering Data With RRDtool
Now that I could receive temperature, as well as humidity, from the sensors I needed to come up with a way to store the information. For this I chose the RRDTool package to manage the data. Its a circular (RR in RRD stands for Round Robin) database that lets you store a predefined amount of data. After initial creation of the DB it is as big as it will ever get and just contains “unknown” data. This is a widely used open source package that has a bit of a steep learning curve on some of its aspects but gives you everything for functionality. It works on multiple platforms including Linux and Windows and has a large, active support community.
The ‘rrdtool create’ command is used to setup the database. Here's the tmpdb.sh bash script I used to set it up:
Once I had setup the database I needed something to read all of the sensors every 5 minutes and place the data in the DB. For this I run a little script:
The script remains in an infinite loop while socat receives data from the sensors. After a complete line has been received, rrdtool updates database.
Graphs
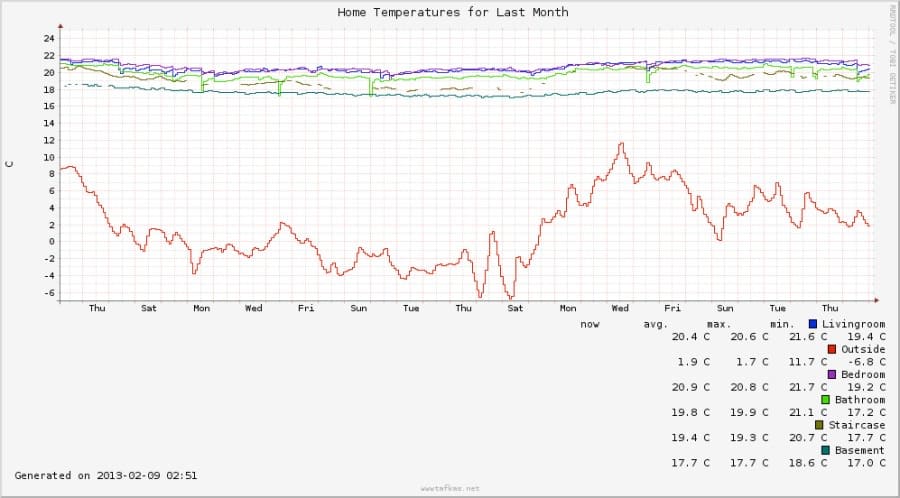
Once you have some data in your temperatures.rrd database it is time to create some charts. rrdtool comes with a built-in graphics engine that can be utilized to easily create some charts. One drawback though is, that the generated charts do not look very appealing:
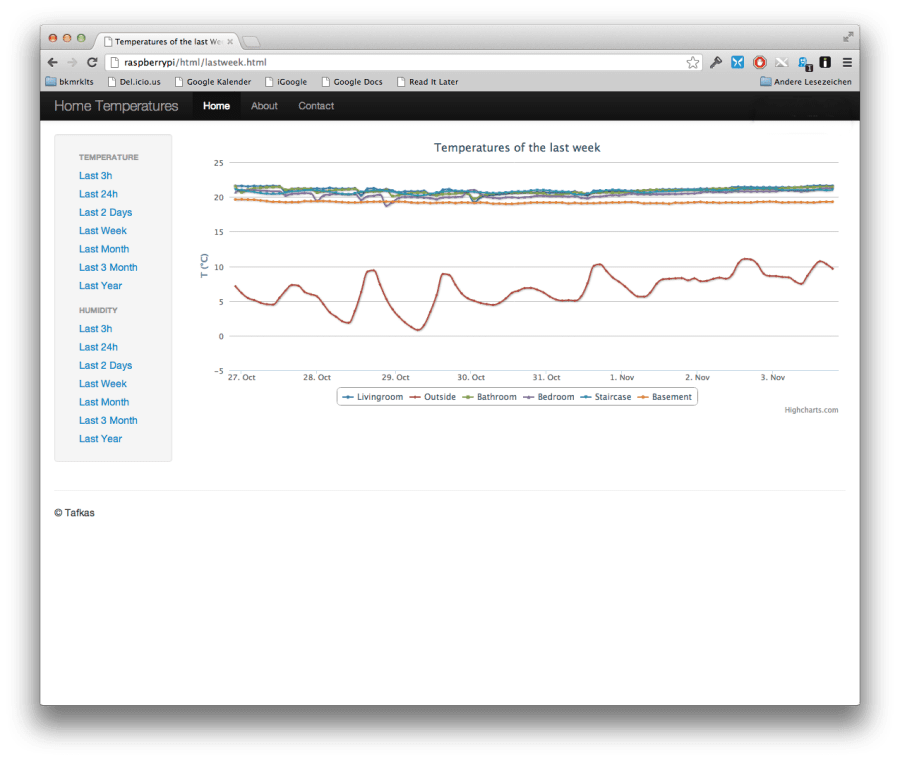
Another reason to avoid pre-generated graphics is that the creating process takes lots of cpu power, where with the RaspberryPi this is a very limited resource. In the beginning I created the charts every five minutes. Later I changed the schedule to every hour for the periods of month and year. Even then I was not totally happy with the result. After looking for alternatives on the Internet I stumbled upon Highcharts, a charting library written in pure JavaScript. This approach delegates the chart generating to the client side. Therefor I export data from the RRDTool to an xml file:
This results in a bunch of xml files. I use the jQuery.get method to get the contents of the xml files. In the success callback function, I parse the returned values, add the results to the series members of the options object, and create the chart:
The resulting chart: