
Using htop to monitor system processes on the Raspberry Pi
If you work a lot on the command line you are probably familiar with the top utility to see what process is taking the most CPU or memory. There’s a similar utility called htop, which is an advanced, interactive system-monitor utility that can be used as a replacement tool for the default process monitoring command ‘top’ on a Linux ecosystem. This interactive process viewer provides a real-time, dynamic view of what’s happening on your Raspberry Pi system. Understanding how to use ‘htop’ to monitor system processes on your Raspberry Pi can enhance your overall management of the device, improve efficiency, and facilitate troubleshooting.
Getting Started with htop
The first step is to install ‘htop’ on your Raspberry Pi. If you're running a Raspberry Pi OS or any other Debian-based distribution, the installation is pretty straightforward. Simply open the terminal and run the following command:
sudo apt-get install htop
Hit enter, then enter your password if prompted, and the system will install htop for you.
Once the installation is concluded, you can start monitoring your system processes. Enter htop at the command prompt:
htop
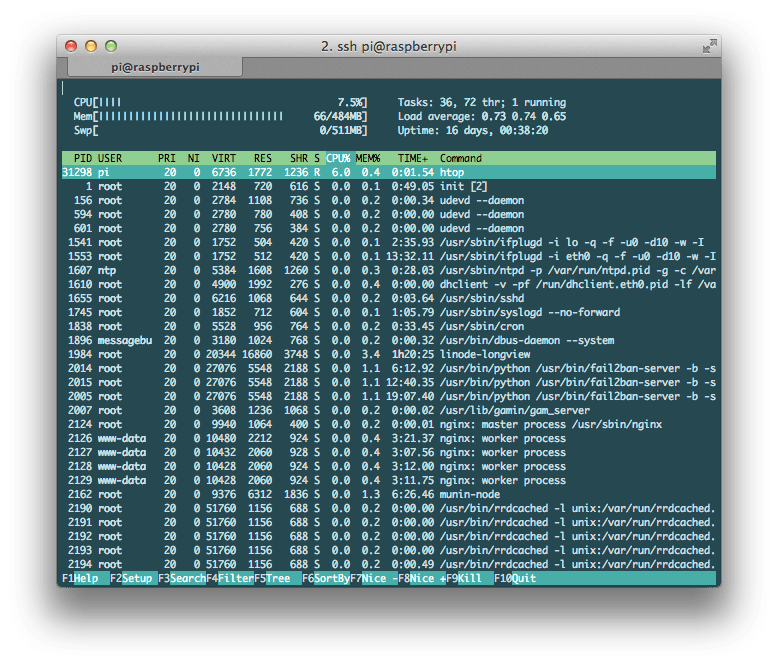
And there you have it! Your Raspberry Pi is now running htop, and you can see an overview of your system’s resources: CPU usage, memory consumption, swap usage, and your system’s uptime among others.
Reading the htop Monitor
Htop's display is divided into three sections. The top section shows statistics about processes and system resource usage. The middle section displays a list of all running processes. This section takes up the majority of the htop window. The third or bottom section has the menu commands.
Understanding each of them in detail:
-
Header info: This section provides a broad view of how the CPU, RAM, and swap memory are performing. You'll get a glance at memory usage, swap space, the number of tasks being handled, and the system's uptime. It also displays load averages and the number of ongoing processes and threads.
-
Process view: The main part of htop reflects a list of all the running processes. It shows the process ID, user, CPU/MEM usage, time, and the command that triggered the process. You have the flexibility to sort processes based on different metrics using F6 or clicking on the headers.
-
Command Menu: This part showcases some keyboard commands you can use within htop: moving up/down using the arrow keys, killing or terminating processes using the F9 key, and refreshing the screen display with F5.
Interacting with Processes
Htop is an interactive tool. One core feature you'll find helpful is the ability to easily search, filter, and manipulate processes without needing to know their process ID. These actions are usually more cumbersome when using the top command.
A few common actions:
-
Kill a process: To terminate an application or task, you can use ‘htop’. Scroll to the process you want to kill, press F9, and then select ‘SIGTERM’. If ‘SIGTERM’ doesn't successfully kill the application, ‘SIGKILL’ should suffice.
-
Search for a process: By pressing F3 or the forward-slash ("/"), you can search for processes based on their names.
-
Filter results: If you're interested in specific sets of processes, use the Filter option, which you can access by pressing F4.
-
Sort processes: ‘htop’ allows you to sort processes based on different attributes such as CPU or memory usage, process ID, user, and more. You can access the sort menu by pressing F6.
Conclusion
The htop tool in Raspberry Pi takes system monitoring to a new level beyond the traditional top command. With its color-coded, GUI-style interface, it provides an interactive platform that makes the task of system monitoring on Raspberry Pi a breeze. Whether you're a seasoned Raspberry Pi user or a beginner, htop will surely elevate your understanding and control of your system, allowing you to optimize its use and handle troubleshooting with confidence.
