Charting Sunrise and Sunset in Highcharts
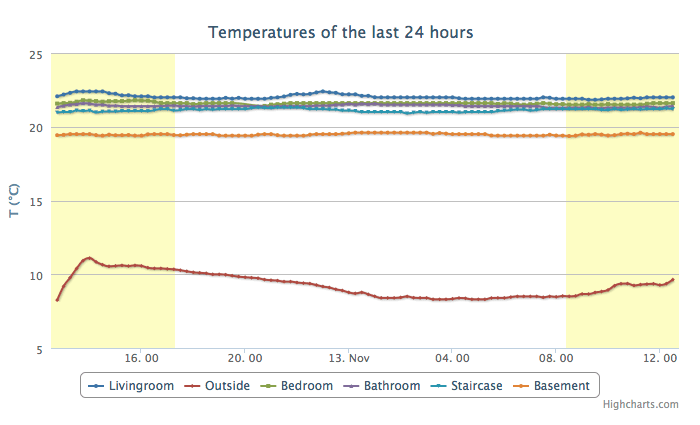
In order to visually enhance my temperature logging I added some Javascript that computes sunrise and sunset for the 24h, 28h, weekly and monthly chart. Then I use this information to plot vertical bands on the chart indicating the effects of the sun on temperatures (and humidities):
To add the bands to your Highchart just get the sunrise and sunset value for a particular day and push it on the xAxis.plotbands.
The resulting chart:
